
You power on your Linux machine, and then you wait. And wait. Thirty seconds pass before the desktop appears. Your SSD is fast, your processor is modern, yet the boot still drags on.
If you are running systemd (which you almost certainly are on any mainstream Linux distribution), the diagnostic tool is already installed. It is called systemd-analyze, and it can tell you exactly where those seconds are going.
In this guide, I will walk you through how to find what is slowing down your Linux boot time with systemd-analyze. You will learn the three core commands, how to interpret their output, which services are safe to disable, and how to build a practical optimization strategy that works across Ubuntu, Fedora, Arch, and other distributions.
We will also address the most common mistake I see in forums and Reddit threads: disabling services blindly based on systemd-analyze blame output without understanding how parallel startup works.
Table of Contents
What systemd-analyze Is and Why It Matters?
systemd-analyze is a built-in diagnostic utility that ships with systemd, the init system and service manager used by virtually every major Linux distribution since around 2015. It measures, analyzes, and visualizes the boot process.
Think of it as a stopwatch and a profiler combined. It records when each phase of boot begins and ends, when each service starts, and which services depend on which others.
Boot performance matters more than you might think. If you boot your machine once or twice a day, saving 10 seconds per boot means reclaiming over an hour per year. For servers that reboot frequently, fleet managers handling thousands of machines, or anyone who suspends and resumes often, those seconds compound fast.
The real power of systemd-analyze is not just that it shows you the total boot time. It breaks that time down into phases and individual services, so you can pinpoint exactly which component is eating your seconds and take targeted action.
Understanding Linux Boot Phases
Before diving into commands, you need to understand the four phases your system passes through during boot. systemd-analyze reports time for each of these separately, and knowing which phase is slow determines your optimization path.
Firmware phase: This is the time your BIOS or UEFI spends initializing hardware. On some machines, especially older ones or systems with complex hardware, this can take 10 to 30 seconds. systemd-analyze cannot fix firmware slowness, but it can tell you if this is your bottleneck.
Boot loader phase: The time GRUB, systemd-boot, or another bootloader spends loading the kernel and initramfs into memory. This is usually 1 to 5 seconds but can spike if the bootloader is waiting for input or searching for boot entries.
Kernel and initrd phase: The Linux kernel initializes hardware drivers and loads the initial ramdisk (initramfs or initrd). The initrd contains essential drivers and tools needed to mount your root filesystem. Bloated initrd images or slow disk decryption can extend this phase.
Userspace phase: This is where systemd takes over. It starts all your services in parallel: networking, display manager, audio, Bluetooth, and everything else. This is the phase systemd-analyze gives you the most control over, and it is usually where the biggest optimization gains come from.
The Three Core systemd-analyze Commands
Three commands form the backbone of boot analysis. Each gives you a different level of detail, and I recommend running all three in sequence.
systemd-analyze time – The Quick Overview
The systemd-analyze time command gives you a high-level breakdown of where time was spent during your last boot.
Run it in your terminal:
systemd-analyze time
Typical output looks like this:
Startup finished in 8.221s (firmware) + 2.104s (loader) + 4.5s (kernel) + 9.8s (userspace) = 24.625s
graphical.target reached after 8.9s in userspace
Each line tells you something important. The first line breaks total boot time into the four phases. The second line tells you when the system reached its default boot target, which is when the system is considered fully booted and ready.
Here is the key insight: if your firmware time is 15 seconds, no amount of service optimization will fix that. You need to look at UEFI settings, disable unnecessary hardware checks, or update your firmware. If your userspace time is high, that is where systemd-analyze blame and critical-chain come in.
The difference between total userspace time and target-reached time matters. Services can still be starting in the background after the graphical target is reached, which is why these two numbers sometimes differ.
systemd-analyze blame – Finding Slow Services
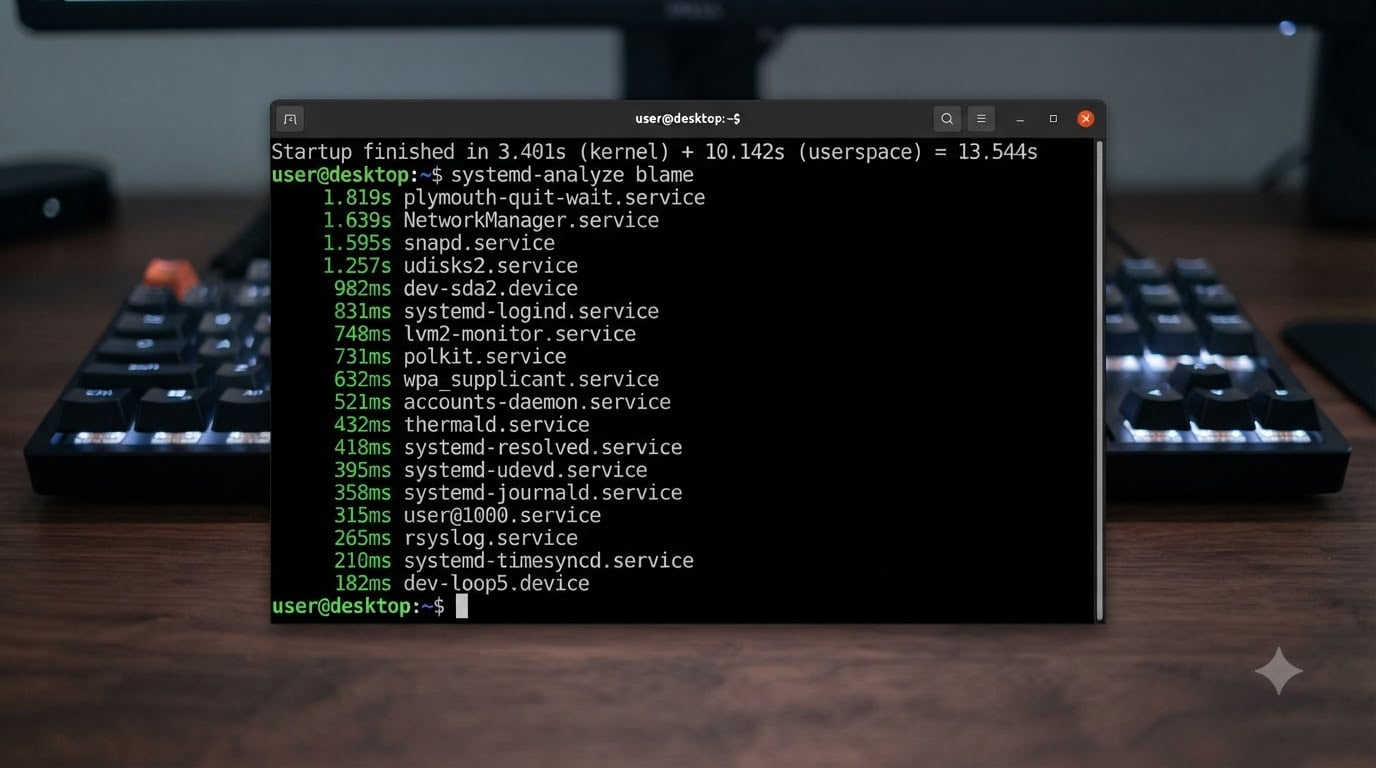
The systemd-analyze blame command lists all services sorted by how long each took to initialize. This is the command most people run first, and it is also the one most commonly misinterpreted.
Run it like this:
systemd-analyze blame
You will get output that looks like:
5.234s NetworkManager-wait-online.service
2.108s systemd-modules-load.service
1.890s dev-sda1.device
1.200s systemd-journal-flush.service
0.892s systemd-tmpfiles-setup.service
0.741s systemd-random-seed.service
Now, here is the critical thing that many guides do not explain: blame shows initialization time, not necessarily the cause of your slow boot. systemd starts services in parallel. A service that took 5 seconds to initialize may have started at the same time as a dozen others and may not have delayed your boot at all.
I have seen too many users on Reddit and the Arch forums disable NetworkManager-wait-online.service because it appears at the top of blame output. Sometimes that is correct. But blame alone does not tell you whether that service was on the critical path. For that, you need critical-chain.
Think of blame as a list of suspects and critical-chain as the conviction evidence. Use blame to identify candidates, then use critical-chain to confirm which ones actually block your boot.
You can also limit the output to the slowest services:
systemd-analyze blame | head -n 20
This shows only the top 20 services, which is usually all you need since the long tail of services starting in under 100 milliseconds is not worth investigating.
systemd-analyze critical-chain – The Dependency Tree
The systemd-analyze critical-chain command is the most important and least understood tool in the set. It traces the dependency chain that actually determined your boot time.
Run it with:
systemd-analyze critical-chain
The output looks like:
graphical.target @8.912s
└─multi-user.target @8.910s
└─NetworkManager-wait-online.service @3.678s +5.234s
└─NetworkManager.service @3.500s +172ms
└─network-pre.target @3.498s
└─iptables.service @3.400s +98ms
The numbers tell a story. The @ symbol shows when the service started relative to boot. The + symbol shows how long it took to complete. A service sitting at the top of a chain with a large + value is something the boot was actively waiting on.
This is the difference from blame. blame says a service took 5 seconds. critical-chain says the boot was waiting on that service, so those 5 seconds extended your total boot time.
You can also target a specific service to see what it was waiting on:
systemd-analyze critical-chain NetworkManager-wait-online.service
This is useful when you see a service at the top of blame and want to understand whether it was on the critical path or just happened to run for a long time in parallel with everything else.
If a service appears in blame with a high time but does not appear in critical-chain, it was running in the background and not blocking boot. You can usually leave it alone.
Visualizing Boot Performance with systemd-analyze plot
The systemd-analyze plot command generates a detailed SVG timeline showing every service, when it started, and how long it took. This is the best way to understand parallel startup.
Generate the plot with:
systemd-analyze plot > boot-analysis.svg
Then open it in any web browser:
xdg-open boot-analysis.svg
The SVG shows a horizontal timeline with colored bars for each service. Services that overlap are running in parallel. A bar extending far to the right indicates a long-running service, and bars stacked on top of each other show parallel execution.
For visual thinkers, this is often more illuminating than the text output. I have had moments where the blame numbers did not click until I saw the plot and realized that one service was starting 8 seconds into boot and blocking everything downstream.
The SVG can be large on systems with many services. If your browser struggles, use critical-chain first to narrow down the problem, then generate a focused plot.
Common Causes of Slow Boot Times
After analyzing hundreds of boot profiles from forum posts, documentation, and my own systems, I have identified the most frequent culprits behind slow boots. Here is what to look for.
NetworkManager-wait-online.service: This is the single most common cause of slow boots. The service waits for network connectivity before allowing boot to proceed. If your network takes time to establish a connection, or if you do not need network at boot, this service can add 5 to 30 seconds. On most desktop systems, it is safe to disable.
Failed or hanging services: A service that fails to start or hangs waiting for a resource can block the critical chain. Check for failed services with:
systemctl --failed
Failed services sometimes retry or wait for timeouts before giving up, which extends boot time silently. Fixing or masking the failed service eliminates the delay.
Slow network mounts: NFS, CIFS, or other network filesystems configured in /etc/fstab can stall boot if the server is unreachable. The mount command waits for a timeout, often 60 to 90 seconds per entry. Use the _netdev mount option and consider automounting network shares after boot.
Initramfs issues: A large or inefficiently compressed initramfs extends the kernel phase. If your kernel time is high, check your initramfs configuration. On Arch, mkinitcpio with zstd compression is fast. On Fedora and RHEL, dracut is the standard. Some users switch to booster for even faster initramfs generation and loading.
Hardware and firmware delays: Firmware initialization time can be significant, especially on laptops with complex hardware. Some UEFI firmware performs extensive hardware checks. Check for firmware updates from your manufacturer, and look for fast boot or quick boot options in UEFI settings.
Excessive kernel modules: Loading unnecessary kernel modules at boot adds time. If you compiled a custom kernel or have a long modules-load list, review whether everything is needed. Forum users have reported devices taking 13 seconds each in blame output, often linked to driver initialization.
How to Optimize Boot Time Safely?
This is where most guides go wrong. They tell you to disable services but do not give you a framework for deciding which ones are safe to remove. Let me give you a practical decision tree.
Step 1: Identify candidates with blame. Run systemd-analyze blame and note services with times over 1 second.
Step 2: Confirm with critical-chain. Run systemd-analyze critical-chain and check which of those candidates appear on the critical path. If a service does not appear here, disabling it will not meaningfully improve boot time.
Step 3: Research the service. Before disabling anything, look up what it does. Run systemctl status servicename to see its description and dependencies. Check the man page if available.
Step 4: Disable, do not mask. Use systemctl disable servicename to stop the service from starting at boot. This is reversible. Only use systemctl mask if you are certain the service should never run under any circumstances, because masking makes it completely unstartable.
Step 5: Reboot and measure. Run systemd-analyze time after rebooting to see if your change helped. If it did not, re-enable the service and move on.
Here is a quick reference for commonly safe-to-disable services:
Generally safe to disable:
NetworkManager-wait-online.service (unless you run services at boot that need network), bluetooth.service (if you do not use Bluetooth), avahi-daemon.service (mDNS, if you do not use it), cups.service (if you do not print), speech-dispatcherd.service (if you do not use speech output), and ModemManager.service (if you do not use mobile broadband).
Think twice before disabling:
systemd-journald (logging, needed for troubleshooting), systemd-logind (session management), polkit (authorization), D-Bus (inter-process communication), udev (device management), and anything related to your display manager or desktop environment.
Never disable:
Anything providing disk encryption, filesystem mounting, or power management, unless you fully understand the consequences and have a recovery plan.
For distro-specific notes: Ubuntu users often find snap-related services consuming boot time. Fedora users may see SELinux-related delays. Arch users have full control but need to be more careful since there are fewer safety nets.
Related Tools: bootchart2 and Advanced Analysis
systemd-analyze covers most needs, but sometimes you want a different perspective. bootchart2 is an alternative boot analysis tool that produces detailed timing charts.
bootchart2 works differently from systemd-analyze. Instead of reading systemd’s timestamps after the fact, it runs a profiler during boot that records CPU and disk activity at regular intervals. This gives you a finer-grained picture of what was happening at every moment.
Install bootchart2 on Arch with:
sudo pacman -S bootchart
On Debian or Ubuntu:
sudo apt install bootchart
Then add it to your kernel command line or initramfs hooks depending on your distribution. After reboot, it generates a PNG or SVG chart showing CPU usage, disk I/O, and process timing throughout boot.
bootchart2 is especially useful when systemd-analyze blame does not explain your problem. If userspace time is reasonable but your boot still feels slow, bootchart2 can reveal kernel-level delays or hardware initialization that systemd does not track.
For most users, systemd-analyze plot is sufficient. But if you need deeper analysis, bootchart2 is a powerful complement.
Troubleshooting Common systemd-analyze Issues
Here are the most common problems users encounter, drawn from real forum discussions.
Boot times vary between boots. This is normal and expected. Network reconnection times, filesystem journal flushing, firmware POST, and background updates all introduce variance. Run systemd-analyze time after several reboots and look at the average rather than a single measurement.
blame shows a service taking very long but critical-chain does not show it. This means the service runs in parallel and does not block boot. This is actually a sign that systemd is working well. The parallel startup means that slow service did not cost you anything.
Permission denied errors. Most systemd-analyze commands work without root, but some operations require elevated privileges. Use sudo if you get permission errors, especially when generating plots or analyzing remote systems.
linux-modules-cleanup.service or similar shows extremely long times. Some distributions have services that perform maintenance tasks during boot. These may show very long run times in blame but often run at low priority and do not block the critical chain. Always check critical-chain before taking action.
Analyzing a remote machine. systemd-analyze supports remote analysis over SSH. Use the -H flag:
systemd-analyze -H user@remotehost time
This is useful for server fleet management and diagnosing boot issues on headless machines.
Frequently Asked Questions
Why is my Linux boot time slow?
Linux boot time can be slow due to firmware initialization delays, bloated initramfs images, services waiting for network connectivity, failed services causing timeouts, or network mounts configured in fstab. Use systemd-analyze time to identify which phase is slow, then use systemd-analyze blame and critical-chain to find specific services causing delays.
How to fix slow boot time?
Run systemd-analyze blame to identify slow services, confirm they are on the critical path with systemd-analyze critical-chain, then disable unnecessary services using systemctl disable servicename. Common fixes include disabling NetworkManager-wait-online.service, fixing failed services shown by systemctl u002du002dfailed, and ensuring network mounts use the _netdev option.
How to optimize Linux boot time?
Optimize boot time by disabling unnecessary services, reducing initramfs size with efficient compression like zstd or lz4, removing unused kernel modules, fixing failed services, and updating firmware. Generate a boot visualization with systemd-analyze plot to identify parallel startup inefficiencies. On servers, consider whether all enabled services are truly needed.
Is systemd-boot faster than GRUB?
systemd-boot is generally faster than GRUB for the bootloader phase because it has a simpler design and reads configuration directly from EFI variables. However, the bootloader phase is typically only 1 to 5 seconds of total boot time. Switching from GRUB to systemd-boot may save a second or two, but optimizing userspace services will have a much larger impact on overall boot performance.
Conclusion
Finding what is slowing down your Linux boot time with systemd-analyze is a straightforward process once you understand the three commands. Start with systemd-analyze time to see which boot phase is slow. Use systemd-analyze blame to identify candidate services, and always confirm with systemd-analyze critical-chain before disabling anything.
The most important takeaway from this guide is that blame shows time, not impact. A service appearing at the top of blame output may be running in parallel and not blocking your boot at all. Critical-chain is the tool that tells you what actually matters.
When optimizing, follow the decision tree: identify, confirm, research, disable, and measure. Never mask a service unless you are absolutely certain it should never run. And always reboot after each change to verify the improvement.
For most users, disabling NetworkManager-wait-online.service and fixing any failed services are the two highest-impact actions. Everything beyond that depends on your specific system and usage patterns.
Open a terminal right now and run systemd-analyze time. You might be surprised by what you find.