
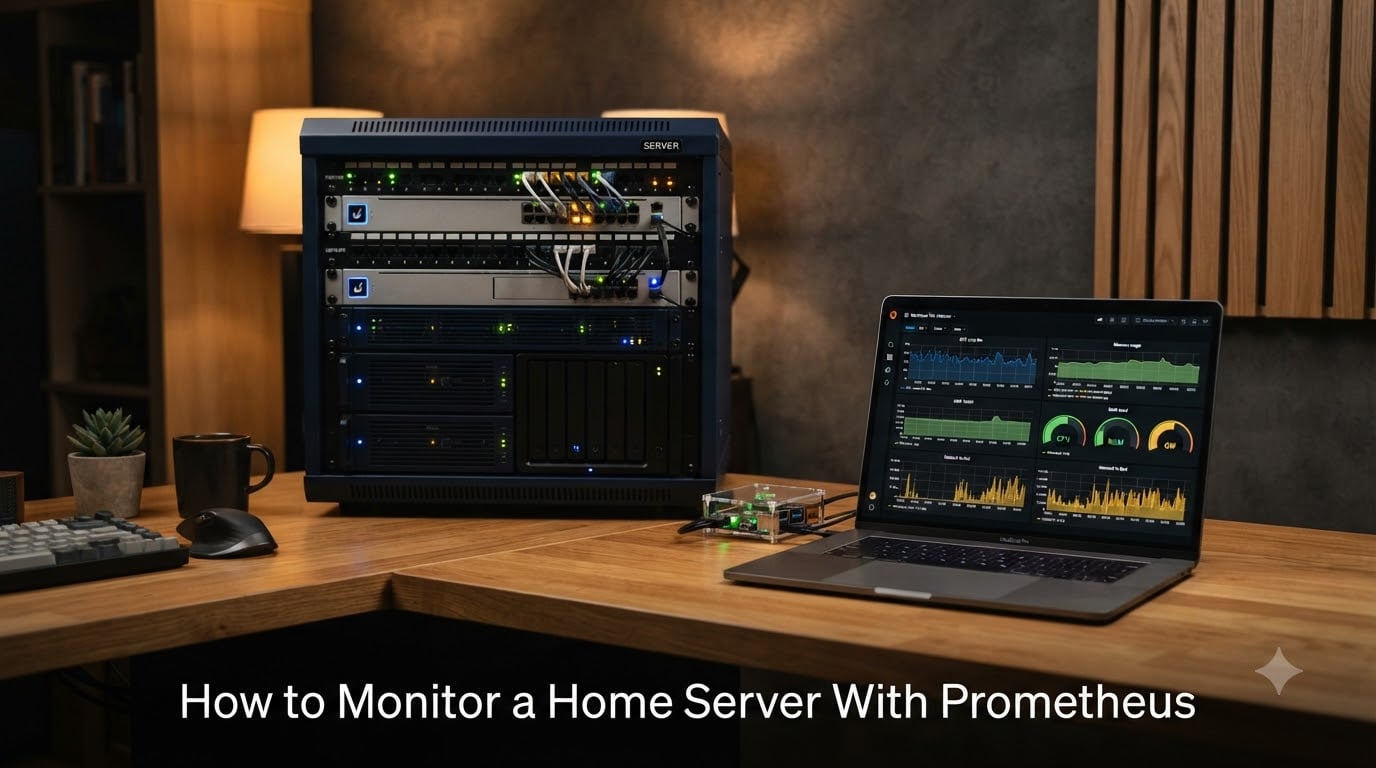
I still remember the morning my home server went silent. Plex was buffering, my Nextcloud sync stalled, and I had no idea whether it was a CPU spike, a dying disk, or just a loose cable. That was the day I committed to monitoring home server Prometheus properly, and I have not looked back since.
Prometheus paired with Grafana is the de facto stack for self-hosters, but the setup can feel overwhelming the first time. This guide is the exact playbook I wish I had – written from real installs across a Raspberry Pi 4, a Proxmox node, and an Unraid box. By the end, you will have dashboards, alerts, and the confidence that your homelab will tell you before it breaks.
In 2026, Prometheus monitoring remains the most flexible, free, and battle-tested option for homelab monitoring. Let us build yours.
Table of Contents
What Is Prometheus and How It Works?
Prometheus is an open-source monitoring system that collects and stores time-series data by scraping metrics endpoints at regular intervals. Unlike traditional agents that push data to a server, Prometheus pulls metrics from each target on a schedule you control.
The whole system has four moving parts. First, the Prometheus server itself stores everything in a local time-series database. Second, exporters like node_exporter expose metrics over HTTP. Third, a scrape configuration tells Prometheus where to find those exporters. Fourth, Grafana queries Prometheus using PromQL and renders the results as dashboards.
This pull-based model has one big advantage for home labs: you do not need to install a heavy agent on every machine. You install a tiny exporter, expose port 9100, and Prometheus does the rest. If your server goes offline, Prometheus will simply mark it as down – which is exactly what you want to know.
Prometheus also ships with its own expression browser, but let us be honest – the graphs there look like 2005 threw up. That is why almost everyone pairs it with Grafana. Grafana turns the same data into beautiful, interactive dashboards you can show off or check from your phone.
Time-Series Database Explained
A time-series database stores data points with timestamps. Each metric is a stream of values – for example, CPU usage at 14:00:01 was 12 percent, at 14:00:02 was 14 percent, and so on. This makes Prometheus extremely fast at queries like “average CPU over the last 24 hours” because the data is already organized by time.
The default storage is on-disk and works well for a home server, but it is not designed to last forever. Most people set a retention period of 15 to 30 days, which strikes a balance between history and disk usage.
PromQL Query Language
PromQL is Prometheus’s query language. It looks intimidating at first, but the basics are approachable. A query like node_cpu_seconds_total returns raw CPU counters, while rate(node_cpu_seconds_total[5m]) turns those counters into a per-second rate over the last five minutes.
Grafana lets you write these queries visually, but learning even a handful of PromQL patterns will unlock far more powerful dashboards.
What Is Node Exporter and Why You Need It?
Node Exporter is the official Prometheus exporter for Linux and Unix system metrics. It runs on your server and exposes details about CPU, memory, disks, network interfaces, filesystem usage, and much more on port 9100.
Think of it as a translator. Your Linux kernel knows everything about your system, but Prometheus cannot read that directly. Node Exporter reads /proc and /sys, packages the values as Prometheus metrics, and serves them over HTTP.
For a home server, node_exporter covers around 90 percent of what you care about. For the remaining 10 percent (Docker containers, GPUs, smart home devices), you can layer in other exporters later.
The default port for node_exporter is 9100, and Prometheus expects to reach it at http://your-server:9100/metrics. If you can curl that URL and see a wall of text with words like node_cpu_seconds_total, your exporter is working.
Prerequisites and System Requirements
Before we install anything, let us make sure your environment is ready. The good news is Prometheus and Grafana are remarkably light. I have run the full stack on a Raspberry Pi 4 with 4GB of RAM, though a small x86 box is more comfortable.
Hardware Requirements
For the monitoring server itself (the one running Prometheus and Grafana), you need at least 1 GB of free RAM and 10 GB of free disk. Prometheus stores everything locally, so plan for roughly 1 to 2 GB per monitored machine per month of retention.
The servers you want to monitor only need enough resources to run node_exporter, which uses about 10 MB of RAM and almost no CPU. I have it running on everything from a Pi Zero to a Threadripper without issue.
Software Requirements
You need a Linux distribution on each server you want to monitor. Ubuntu, Debian, Fedora, Arch, and Alpine all work. Windows is supported separately via windows_exporter, which we will touch on later.
You also need Docker installed if you plan to use the container route, or systemd if you want native services. Either approach works; we will cover both.
Network Considerations
Prometheus needs to reach each node_exporter over the network. If your monitoring server and target servers are on the same LAN, this is trivial. If you want to monitor a VPS, you will need to expose port 9100 (or use a VPN like WireGuard or Tailscale).
I strongly recommend keeping your monitoring stack on a private network. Exposing Prometheus or Grafana to the public internet without authentication is how homelabs get popped.
Docker vs Native Installation: Which Should You Pick
This question comes up constantly on r/selfhosted, and the honest answer is: it depends on your setup.
Docker Compose Advantages
Docker Compose is faster to set up, easier to back up (just save the YAML), and trivial to move to another machine. Updates are a single command. Most homelab users prefer it because the entire stack can be defined in one file.
For a beginner, Docker Compose removes dozens of small papercuts: no systemd unit files, no user permission headaches, no fighting with default config paths. You edit a YAML, run docker compose up -d, and everything starts.
Native Installation Advantages
Native installs use fewer resources. On a Raspberry Pi, the difference between a 300 MB Docker Prometheus and a 70 MB native binary is meaningful. You also get direct access to logs and processes without docker exec.
If you are running on bare metal and want to squeeze every megabyte, native is the way. It is also easier to integrate with system tools like logrotate and systemd timers.
My Recommendation
For most home server monitoring setups, I recommend Docker Compose for the monitoring server and native installs for node_exporter on the machines being monitored. That gives you the convenience of container-based management for the heavy lifting while keeping the exporters as lightweight as possible on every endpoint.
Installing Node Exporter on Your Home Server
We will start with node_exporter because nothing else works without it. There are two ways to install it: native (recommended for endpoints) and Docker (fine for testing).
Native Install on Linux
Step 1: Download the latest release from the Prometheus downloads page. At the time of writing, version 1.8.x is current.
wget https://github.com/prometheus/node_exporter/releases/download/v1.8.2/node_exporter-1.8.2.linux-amd64.tar.gzStep 2: Extract the archive and move the binary into your PATH.
tar xvf node_exporter-1.8.2.linux-amd64.tar.gz
sudo cp node_exporter-1.8.2.linux-amd64/node_exporter /usr/local/bin/
Step 3: Create a dedicated system user. Running exporters as root is a bad habit.
sudo useradd --no-create-home --shell /usr/sbin/nologin node_exporter
sudo chown node_exporter:node_exporter /usr/local/bin/node_exporter
Step 4: Create a systemd service file at /etc/systemd/system/node_exporter.service with the following contents.
[Unit]
Description=Node Exporter
After=network.target

[Service]
User=node_exporter
ExecStart=/usr/local/bin/node_exporter
Restart=always

[Install]
WantedBy=multi-user.target
Step 5: Enable and start the service.
sudo systemctl daemon-reload
sudo systemctl enable --now node_exporter
Step 6: Verify it is listening on port 9100.
curl http://localhost:9100/metricsIf you see a flood of metrics like node_cpu_seconds_total, you are golden.
Docker Install
If you prefer Docker, the official image is one line:
docker run -d --name node_exporter --restart=always --net="host" prom/node_exporter:latestThe --net="host" flag is important because it lets the exporter bind port 9100 directly without NAT complications.
Windows Servers
For Windows machines, install windows_exporter instead. The binary is at https://github.com/prometheus-community/windows_exporter/releases and exposes the same metrics under different names (prefixed with windows_). The community dashboard supports both with minor tweaks.
Installing and Configuring Prometheus
Now that node_exporter is running, let us install Prometheus and teach it where to scrape.
Step 1: Create Directories and Download
sudo mkdir /etc/prometheus /var/lib/prometheus
wget https://github.com/prometheus/prometheus/releases/download/v2.54.1/prometheus-2.54.1.linux-amd64.tar.gz
tar xvf prometheus-2.54.1.linux-amd64.tar.gz
sudo cp prometheus-2.54.1.linux-amd64/prometheus /usr/local/bin/
sudo cp prometheus-2.54.1.linux-amd64/promtool /usr/local/bin/
Step 2: Create a prometheus.yml Configuration
This is the file that tells Prometheus everything. Create /etc/prometheus/prometheus.yml with these contents.
global:
  scrape_interval: 15s
  evaluation_interval: 15s

scrape_configs:
  - job_name: 'node_exporter'
    static_configs:
      - targets:
          - 'localhost:9100'
          - 'nas.local:9100'
          - 'pi-hole.local:9100'

  - job_name: 'prometheus'
    static_configs:
      - targets: ['localhost:9090']
The scrape_interval of 15 seconds is a good default. Lower values give more resolution but increase storage. The targets list is where you add every machine running node_exporter. Replace the hostnames with your actual server addresses.
Step 3: Create the Prometheus User and Service
sudo useradd --no-create-home --shell /usr/sbin/nologin prometheus
sudo chown -R prometheus:prometheus /etc/prometheus /var/lib/prometheus

cat <
After 30 seconds, visit http://your-server:9090 and you should see the Prometheus UI. Click "Status" then "Targets" to confirm node_exporter is being scraped successfully.
Docker Compose Alternative
If you prefer Docker Compose, here is a complete stack you can drop into a folder.
version: '3.8'

services:
  prometheus:
    image: prom/prometheus:latest
    container_name: prometheus
    restart: unless-stopped
    volumes:
      - ./prometheus.yml:/etc/prometheus/prometheus.yml
      - prometheus_data:/prometheus
    ports:
      - "9090:9090"
    command:
      - '--config.file=/etc/prometheus/prometheus.yml'

  grafana:
    image: grafana/grafana:latest
    container_name: grafana
    restart: unless-stopped
    depends_on:
      - prometheus
    volumes:
      - grafana_data:/var/lib/grafana
    ports:
      - "3000:3000"

  node-exporter:
    image: prom/node-exporter:latest
    container_name: node-exporter
    restart: unless-stopped
    pid: host
    volumes:
      - /proc:/host/proc:ro
      - /sys:/host/sys:ro
      - /:/rootfs:ro
    command:
      - '--path.rootfs=/host'
    ports:
      - "9100:9100"

volumes:
  prometheus_data:
  grafana_data:
Run docker compose up -d and you have a full monitoring stack. I use this exact pattern on my Proxmox node.
Installing Grafana and Connecting It to Prometheus
Grafana is the visualization layer. Without it, Prometheus is just numbers in a database.
Step 1: Install Grafana
On Debian or Ubuntu, the official repository is the cleanest path:
sudo apt-get install -y adduser libfontconfig1 musl
wget https://dl.grafana.com/oss/release/grafana_11.2.0_amd64.deb
sudo dpkg -i grafana_11.2.0_amd64.deb
sudo systemctl enable --now grafana-server
Docker users already have Grafana from the compose file above. Both methods work identically.
Step 2: Access the Web Interface
Open http://your-server:3000 in a browser. The default login is admin with password admin. Grafana will force you to change this on first login - good security by default.
Step 3: Add Prometheus as a Data Source
Step 1: Click the gear icon in the left sidebar, then "Data sources".
Step 2: Click "Add data source" and choose Prometheus.
Step 3: Set the URL to http://prometheus:9090 (Docker Compose network name) or http://localhost:9090 (native install).
Step 4: Click "Save and test". You should see a green "Data source is working" banner.
If you see a red error, the most common cause is a wrong URL or a firewall blocking port 9090. I have hit this more times than I care to admit.
Importing Your First Dashboard
You do not need to build dashboards from scratch. The Grafana community has thousands of pre-built dashboards, and dashboard 1860 (Node Exporter Full) is the gold standard for system metrics.
Step 1: Open the Import Menu
Click the plus icon in the left sidebar and choose "Import".
Step 2: Enter Dashboard ID 1860
Paste 1860 in the "Import via grafana.com" field and click "Load". Grafana will fetch the dashboard definition from the community site.
Step 3: Select Your Prometheus Data Source
When prompted, choose the Prometheus data source you just created. The dashboard will populate with all your node_exporter metrics within a few seconds.
You will immediately see panels for CPU usage, memory, disk I/O, network traffic, and more. This single dashboard is enough to diagnose 90 percent of homelab performance issues.
Other Useful Dashboards
Dashboard 15172 (Node Exporter for Prometheus Dashboard) is a more modern alternative with cleaner visuals. Dashboard 11074 works well for Docker hosts. For Proxmox users, dashboard 15356 is purpose-built. Browse grafana.com/grafana/dashboards for hundreds more.
Understanding Key Metrics
Having data is not the same as understanding it. Here are the metrics that matter most for a home server and what healthy values look like.
CPU Metrics
node_cpu_seconds_total breaks CPU usage down by mode (user, system, idle, iowait). Sustained iowait above 20 percent usually means your disks are the bottleneck, not the CPU itself. For a media server, total CPU usage above 70 percent during transcode is normal; above 90 percent idle is a problem.
Memory Metrics
node_memory_MemAvailable_bytes is more useful than "used" because it accounts for reclaimable cache. On Linux, "available" memory staying below 10 percent of total is when you should worry about the OOM killer getting aggressive.
Disk Metrics
node_filesystem_avail_bytes tells you how much space is left. node_disk_io_now shows current queue depth, which spikes when disks are saturated. Watch for SMART errors in node_smartctl_device_smart_status if you have that collector enabled.
Network Metrics
node_network_receive_bytes_total and node_network_transmit_bytes_total show traffic per interface. Spikes during off-hours can hint at unwanted activity. Track node_network_mtu_bytes if you suspect misconfigured jumbo frames.
Load Average
node_load5 shows the 5-minute load average. A rule of thumb: anything above the number of CPU cores indicates the system is overloaded. A persistent load5 of 8 on a 4-core machine means something is wrong.
Setting Up Alerts That Actually Help
Alerts are where monitoring becomes useful. A dashboard you only look at after something breaks is just a pretty log. Alerts tell you while you can still fix it.
Step 1: Create Alert Rules in Prometheus
Add a new file at /etc/prometheus/rules.yml:
groups:
  - name: homelab
    rules:
      - alert: HighCpuUsage
        expr: 100 - (avg by(instance) (rate(node_cpu_seconds_total{mode="idle"}[5m])) * 100) > 85
        for: 5m
        labels:
          severity: warning
        annotations:
          summary: "High CPU on {{ $labels.instance }}"
          description: "CPU usage has been above 85% for 5 minutes."

      - alert: LowDiskSpace
        expr: (node_filesystem_avail_bytes{mountpoint="/"} / node_filesystem_size_bytes{mountpoint="/"}) * 100 < 10
        for: 10m
        labels:
          severity: critical
        annotations:
          summary: "Disk almost full on {{ $labels.instance }}"

      - alert: HostDown
        expr: up == 0
        for: 2m
        labels:
          severity: critical
        annotations:
          summary: "Target {{ $labels.instance }} is down"
Reference this file from prometheus.yml:
rule_files:
  - "rules.yml"
Step 2: Restart Prometheus
sudo systemctl restart prometheusStep 3: Configure Grafana Alerting
Open Grafana, go to "Alerting" then "Contact points", and add a notification channel. Email is the simplest. Discord, Slack, Telegram, and Pushover all work too. I use Telegram because it is free and instant.
Then go to "Alerting" then "Alert rules" and create rules that reference Prometheus queries. Grafana will fire alerts based on PromQL expressions, and Prometheus's own alerts will appear under "External" alert sources.
Threshold Recommendations
For a home server, these thresholds are a sensible starting point. CPU sustained above 85 percent. Memory available below 10 percent. Disk usage above 90 percent. Load5 above 2 times the core count. Network errors per second above 100. Tune them based on your actual usage after a couple of weeks.
Be careful not to over-alert. The fastest way to start ignoring alerts is to fire 50 of them a day. Start with the three above and add more only when you actually need them.
Monitoring Multiple Home Servers
Once you have one server working, adding more is trivial. Each new node just needs node_exporter installed and an entry in your prometheus.yml.
Updating the Scrape Config
scrape_configs:
  - job_name: 'node_exporter'
    static_configs:
      - targets:
          - 'nas.local:9100'
          - 'pi.local:9100'
          - 'workstation.local:9100'
          - 'vpn-gateway.local:9100'
Use DNS names rather than IPs so the config survives DHCP changes. If you do not have a local DNS server, /etc/hosts entries on the Prometheus server work fine for a small homelab.
Using File-Based Service Discovery
For larger setups, edit a JSON file and let Prometheus discover targets automatically.
scrape_configs:
  - job_name: 'node_exporter'
    file_sd_configs:
      - files:
          - '/etc/prometheus/targets/*.json'
Drop a file like /etc/prometheus/targets/nodes.json with the targets array, and Prometheus will reload it on each scrape. This makes adding or removing servers a one-line config change.
Using Labels to Group Servers
Add labels to your targets so you can filter dashboards by location or role:
static_configs:
  - targets: ['nas.local:9100']
    labels:
      role: storage
      location: rack
  - targets: ['pi.local:9100']
    labels:
      role: network
      location: living-room
Now your dashboard can show "all storage nodes" or "all living-room devices" with a single query variable.
Securing Your Monitoring Stack
Your monitoring stack sees everything about your home network. Treat it accordingly.
Enable Grafana Authentication
Grafana ships with authentication enabled by default. Make sure you changed the admin password during setup, and create separate users for anyone else who needs access. Avoid the "anonymous access" toggle in the config.
Put Prometheus Behind a Reverse Proxy
Caddy, Nginx Proxy Manager, or Traefik can all front Prometheus with HTTPS and basic auth. This is the simplest way to expose your monitoring remotely without leaking data in plaintext.
# Caddy example
prom.example.com {
  basicauth {
    admin $2a$14$...
  }
  reverse_proxy localhost:9090
}
Use a VPN for Remote Access
If you want to check dashboards from your phone while away from home, run Prometheus and Grafana only on your VPN network. Tailscale is the easiest option for non-technical family members, and WireGuard is the most performant.
Limit Node Exporter Exposure
Node exporter does not need to be on the public internet. Bind it to your LAN IP only, or restrict it with a firewall. On most home routers this is automatic, but it is worth double-checking.
Keep Things Updated
Both Prometheus and Grafana release monthly. Subscribe to their GitHub release feeds or use Watchtower for your Docker containers. Old versions accumulate CVEs over time.
Troubleshooting Common Issues
I have hit every error in this section at least once. Here is what usually goes wrong and how to fix it.
"Target Down" in Prometheus
This means Prometheus cannot reach the exporter. Check that node_exporter is running on the target with systemctl status node_exporter. Confirm port 9100 is open with ss -tlnp | grep 9100. Then test from the Prometheus server with curl http://target:9100/metrics. Most "target down" errors are firewall issues or wrong hostnames.
Dashboard Shows "No Data"
Usually this means the data source URL is wrong or the time range is empty. Open the panel, click "Edit", and verify the Prometheus query returns something in the expression browser. If it works there but not in Grafana, the data source configuration is the culprit.
Prometheus Uses Too Much Disk
Reduce retention by adding --storage.tsdb.retention.time=15d to the Prometheus command. You can also drop your scrape interval to 30 seconds, which roughly halves storage use. Check current usage in /var/lib/prometheus.
Port Conflicts
Port 9090 is Prometheus, 3000 is Grafana, 9100 is node_exporter. If another service is using one, change the exporter or Grafana port in its config. For Docker Compose, edit the ports mapping.
Docker Containers Cannot Reach Each Other
Make sure all containers are on the same Docker network. In a compose file this happens automatically. If you are running containers separately, use docker network create and attach each container.
Grafana Shows Old Data After Restart
Make sure you are using a named volume or bind mount for /var/lib/grafana. If you are running with docker run without -v, Grafana starts fresh every restart.
Frequently Asked Questions
How do I set up Prometheus to monitor my home server?
Install node_exporter on the server you want to monitor, then install Prometheus on a separate machine (or the same one). Add the exporter’s address to the scrape_configs section of prometheus.yml and start Prometheus. Finally, install Grafana and add Prometheus as a data source so you can visualize the metrics on a dashboard.
What is Node Exporter and why do I need it?
Node Exporter is a small program that runs on Linux and Unix machines and exposes system metrics (CPU, memory, disk, network) over HTTP on port 9100. Prometheus cannot read system data directly, so node_exporter acts as a translator. Without it, Prometheus has nothing to scrape.
How do I connect Grafana to Prometheus?
Open Grafana, go to Connections then Data sources, click Add data source, choose Prometheus, and enter the URL where Prometheus is running (http://localhost:9090 for native installs or http://prometheus:9090 for Docker Compose). Click Save and test – a green banner confirms the connection works.
What metrics can I collect with Prometheus?
With node_exporter you get CPU usage by mode, memory available and used, disk space and I/O operations, network traffic and errors, filesystem inodes, temperature sensors, and load averages. Additional exporters add Docker container stats, MySQL queries, smart home devices, and dozens of other services.
How do I create alerts in Grafana?
Go to Alerting then Contact points and add a notification channel (email, Slack, Discord, Telegram, etc.). Then create alert rules that reference PromQL queries against your data source. Set thresholds like CPU above 85% for 5 minutes, and Grafana will fire alerts automatically when those conditions are met.
Conclusion
Setting up monitoring for your home server with Prometheus and Grafana takes a single afternoon, but the peace of mind lasts for years. Once the stack is running, you will finally know what your hardware is doing, and you will catch problems long before they reach your users.
If you have followed this guide end-to-end, you should have node_exporter running on every server, Prometheus scraping them on a 15-second interval, Grafana showing the Node Exporter Full dashboard, and at least one alert configured for disk and CPU issues. That is a complete, production-grade homelab monitoring setup.
From here, consider adding exporters for your specific services - Docker, Nextcloud, Plex, or your database of choice. Browse the dashboards at grafana.com/grafana/dashboards for inspiration, and remember: the best monitoring setup is the one you actually look at.
Now go install it. Your home server Prometheus monitoring setup is waiting, and your future self will thank you the next time something goes sideways at 2 AM.