
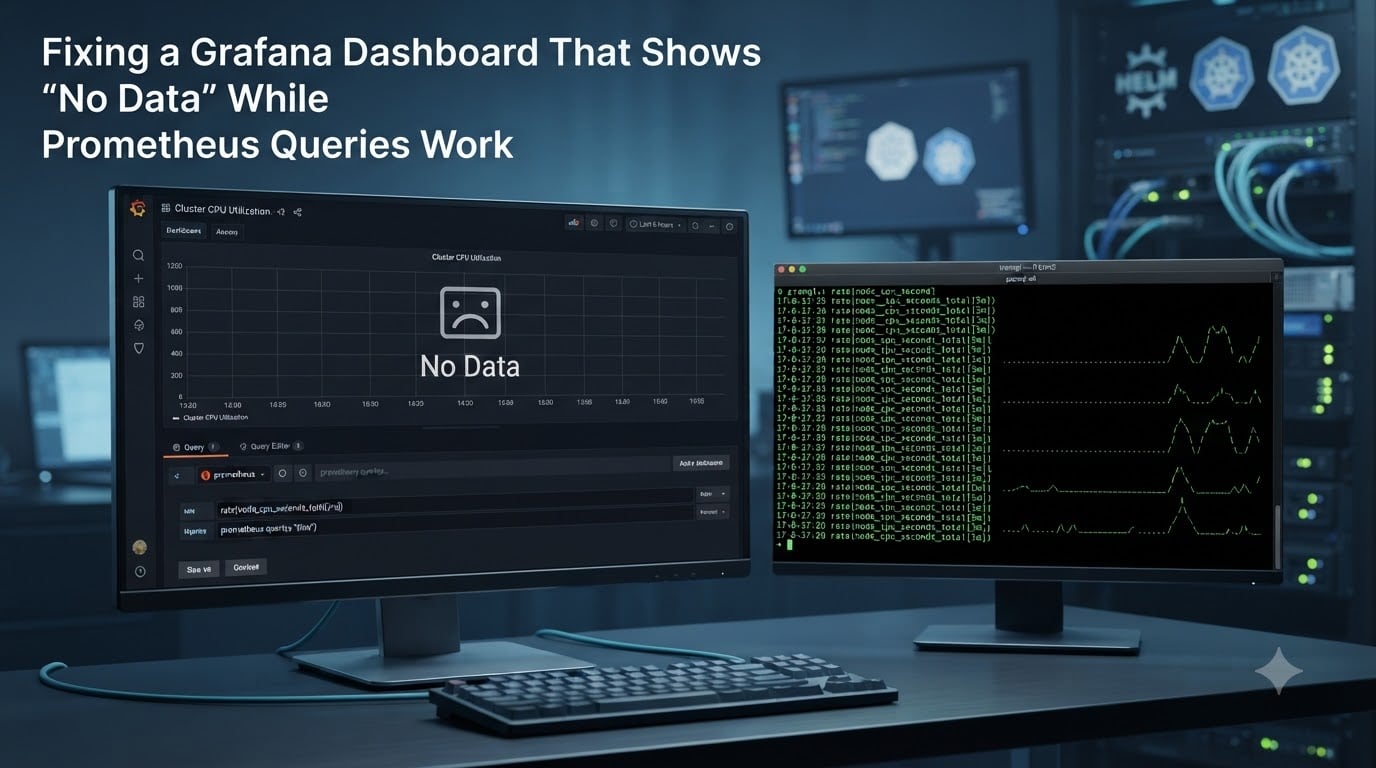
I have hit this exact wall more times than I can count, and it is one of the most confusing problems in the Grafana stack. You open Prometheus, run a query, see clean metrics, then switch to your dashboard and every panel screams “No Data”. This guide is the diagnostic path I now use whenever a Grafana dashboard shows “No Data” while Prometheus queries work.
The good news is that this almost never means Prometheus is broken. If your query returns results in Explore but not in panels, the problem lives inside Grafana: time range, variables, refresh rate, datasource binding, or panel JSON. In the next ten minutes we will walk through every common cause, in the order I check them on a real production system.
Table of Contents
Prerequisites: Confirm Prometheus Actually Has the Data
Before we touch Grafana, we need to rule out the one scenario where Prometheus itself is the problem: data really isn’t being scraped. I have wasted hours before because I trusted a panel that was wrong.
Open your Prometheus UI at http://<prometheus-host>:9090 and check three things:
- Go to Status > Targets. Every target should show
UP. If anything isDOWN, the scrape is failing and no panel will ever have data. - Go to the graph view and run an instant query like
up. You should see a1for each healthy target. - Run your real metric, for example
rate(node_cpu_seconds_total[5m]). If this returns data, Prometheus is healthy.
If the targets are all UP and the metric returns samples, Prometheus is doing its job. The problem is between Prometheus and Grafana, and the rest of this guide will find it.
Why Explore Works but Panels Show “No Data”
This is the mental model nobody explains well. Grafana’s Explore view runs your query in a temporary context: it uses the time range from the picker, the datasource you select, and the variables currently set. It does not care about the dashboard definition.
A panel, on the other hand, runs inside the dashboard context. It inherits:
- The dashboard’s time range (unless the panel overrides it).
- The dashboard’s auto-refresh interval.
- The dashboard’s variables and their current values.
- The panel’s own datasource setting (which may differ from the dashboard default).
- The panel’s own time range override, if any.
That means a query that works perfectly in Explore can fail in a panel because any one of those overrides is wrong. Our job is to find which one. We will work from the most likely to the least likely cause.
Step 1: Test the Prometheus Datasource Connection
The first thing I do is open Connections > Data sources in Grafana, select my Prometheus datasource, scroll to the bottom, and click Save & test. I want to see the green “datasource is working” banner.
If the test fails, the panel cannot possibly show data. The most common causes are:
- Wrong URL: in Kubernetes, the URL is usually
http://prometheus.monitoring.svc.cluster.local:9090, notlocalhost. Grafana runs in a different pod and cannot resolvelocalhostas Prometheus. - Wrong port: Prometheus default is 9090. If you changed it, update the URL.
- Network policy blocking traffic: I have seen clusters with NetworkPolicies that allow Grafana to scrape Prometheus UI but block the query API. Check the namespace’s egress rules.
- Basic auth / bearer token if Prometheus is behind a reverse proxy.
Quick fix from the shell inside the Grafana pod:
kubectl exec -n monitoring deploy/grafana -- curl -s http://prometheus.monitoring.svc.cluster.local:9090/api/v1/query?query=upIf that returns JSON with "status":"success", Grafana can reach Prometheus. The datasource settings are correct and we can move on.
Step 2: Inspect Grafana Server Logs
If the datasource test passes but panels still show “No Data”, the next place I look is the Grafana server logs. They almost always contain a clue, but you have to know what to look for.
For self-hosted Grafana:
# Docker
docker logs -f grafana 2>&1 | grep -i "error|prometheus|datasource"

# Kubernetes
kubectl logs -n monitoring deploy/grafana --tail=200

# systemd
journalctl -u grafana-server -n 200 --no-pager
Common log lines I look for:
datasource not found: <uid>— the panel references a datasource UID that does not exist. Step 8 will fix this.query error: ... context deadline exceeded— the query took longer than the timeout. Covered in Step 5.parse error: ... unexpected— the PromQL is malformed in this panel but not in your Explore query.401 Unauthorizedor403 Forbidden— the datasource requires auth and the credentials are wrong for this Grafana org.
If the logs are silent, increase the log level temporarily by setting [log] level = debug in grafana.ini and restarting. Re-run a panel query and watch the logs fill up with query details.
Step 3: Check the Dashboard Time Range
This is the single most common cause I see, and it is the one users waste the most time on. The dashboard time range does not match the time range where Prometheus has data.
I always do three checks:
- Click the dashboard time picker (top right). Make sure it is set to a window where Prometheus has metrics. If you just started Prometheus five minutes ago but your dashboard is set to “Last 30 days”, every panel will be empty.
- Open any panel and check Panel options > Time range. If “Override relative time” is enabled, that panel uses a different range than the rest of the dashboard.
- Check the dashboard timezone. Prometheus stores timestamps in UTC. If your dashboard timezone is set to Pacific and Prometheus scraped data during a UTC window that straddles your local “now”, the panel can fall outside the selected range.
Quick test: change the dashboard time range to “Last 5 minutes” and refresh. If data suddenly appears, the issue is the time range, not the data.
Step 4: Verify Template Variables Resolve Correctly
Template variables silently break panels when they resolve to empty values. A query like rate(node_cpu_seconds_total{instance=~"$instance"}[5m]) returns nothing if $instance is empty.
Open Dashboard settings > Variables and inspect each one. I check:
- The Query field still returns results when run directly in Prometheus.
- The Regex field is not filtering out everything.
- The Refresh option is set to “On time range change” so the variable updates with the dashboard.
Click the variable’s Inspect link. It will show you the actual values Grafana is sending to the panel. If you see {} or an empty array, the variable is broken and every panel using it will be empty.
For dashboards that used to work, I usually find a renamed label, a deleted job, or a regex that no longer matches the new metric shape.
Step 5: Fix Scrape Interval vs rate() Range Mismatch
This one bites people running rate(), irate(), increase(), or any function that needs at least two samples. If the range inside your function is smaller than your scrape interval, the function returns no data.
Concretely: if Prometheus scrapes a target every 30 seconds and you write rate(metric_total[10s]), Prometheus will only see one sample per scrape and cannot compute a rate. The panel will show “No Data”.
Grafana provides a magic variable called $__rate_interval that automatically picks a safe range based on the scrape interval:
rate(node_cpu_seconds_total{mode!="idle"}[$__rate_interval])If you prefer a fixed safe value, use a range that is at least 4x your scrape interval. For a 15s scrape, use rate(...[1m]) or larger.
You can check your scrape interval in prometheus.yml:
global:
  scrape_interval: 15s
If you must change it, restart Prometheus. To apply without a full restart, send SIGHUP to the Prometheus process or, in Kubernetes, restart the deployment.
Step 6: Diagnose Mixed Datasource Issues (Especially in Grafana 11)
Mixed datasource panels run queries against multiple backends and combine the results. They are notoriously fragile, and Grafana 11 introduced a regression that broke many existing mixed panels after upgrade.
If your panel uses a datasource named “Mixed” or has multiple queries against different datasources:
- Open the panel and switch each query to a single, concrete datasource.
- Test whether data returns. If it does, mixed mode was the problem.
- Check Panel options > Queries and ensure no leftover transformations reference the mixed source.
For Grafana 11 specifically, the “Mixed datasource” plugin sometimes needs to be re-enabled after upgrade:
grafana-cli plugins enable grafana-mixed-datasourceIf you do not actually need mixed datasource semantics, I strongly recommend rewriting the panel with a single Prometheus query. It removes a whole class of “No Data” bugs.
Step 7: Verify Required Plugins Are Installed
Some panels depend on specific plugins (for example, the Pie Chart, Status Panel, or any community visualization). If the plugin is missing, the panel silently renders as “No Data” rather than showing an error.
Check installed plugins:
grafana-cli plugins lsIf a plugin is missing, install it and restart Grafana:
grafana-cli plugins install <plugin-id>
systemctl restart grafana-server
In Kubernetes via the official Helm chart, add the plugin to values.yaml:
grafana:
  plugins:
    - grafana-piechart-panel
    - grafana-clock-panel
Then upgrade the Helm release. The init container will install the plugin before Grafana starts.
Step 8: Check Provisioned Dashboard YAML and JSON
If you load dashboards through file provisioning, a bad YAML, a missing UID, or a wrong datasource reference will cause panels to render as empty without surfacing a clear error in the UI.
Check the Grafana logs for lines like:
provisioning: failed to load dashboard from /etc/grafana/provisioning/dashboards/cluster.json
provisioning: dashboard uid mismatch
Common YAML issues:
- Tab indentation instead of spaces.
- A referenced datasource UID that does not exist in your Grafana.
- YAML anchor typos.
- Dashboard JSON with a trailing comma.
Validate your YAML with yamllint and your JSON with jq:
yamllint dashboards.yaml
jq . cluster.json > /dev/null && echo "valid JSON"
After fixing, restart Grafana or reload provisioning:
curl -X POST http://admin:admin@localhost:3000/api/admin/provisioning/dashboards/reloadStep 9: Inspect and Repair Panel JSON
When everything else fails, the panel JSON itself is usually wrong. I export the dashboard JSON, find the broken panel, and inspect the targets and datasource fields.
Export the dashboard:
- Open the dashboard.
- Click the share icon and select Export.
- Choose Export for sharing externally to get a clean JSON.
Look for these patterns inside each panel:
"datasource": { "type": "prometheus", "uid": "<something>" }— theuidmust match an existing datasource. A common cause of “No Data” is a renamed or deleted datasource UID."targets": []— an empty targets array means no query will run."expr": ""— an empty PromQL expression."refId": ""— a missing refId breaks panel linking.
If a panel is broken beyond repair, I duplicate a working panel and copy the query, datasource, and field config from a healthy one. This usually restores data within seconds.
Managed Grafana Quirks: Azure Managed Grafana and Grafana Cloud
Managed Grafana instances have a few default settings that quietly break panels. I have been bitten by all of these on Azure Managed Grafana and Grafana Cloud.
Query timeout: Azure Managed Grafana defaults to a 30s query timeout. If your PromQL is expensive, the panel times out and renders as “No Data” instead of an error. Raise it in Settings > Data sources > Prometheus > Query timeout.
Private link / network access: if Prometheus runs in a private VNet and Grafana cannot reach it through a private endpoint, the datasource test may pass (because of cached credentials) but queries fail silently. Verify the network path.
Service account tokens: managed Grafana often uses service account tokens, not API keys. If the token expired, queries return 401 and the panel shows “No Data”. Rotate the token and update the datasource.
Organization permissions: in Grafana Cloud and Azure Managed Grafana, datasource access is scoped to organizations. A user without the right org role can see the dashboard but get “No Data” because they have no datasource access. Check the user’s role under Administration > Users and teams.
Common Error Messages and Fixes
| Error in Logs or Panel | Likely Cause | Fix |
|---|---|---|
datasource not found | Datasource UID missing or renamed | Re-link the panel to a valid datasource |
parse error at char N | Malformed PromQL in panel | Compare the panel query with the working Explore query |
context deadline exceeded | Query timeout | Raise the timeout or optimize the query |
401 Unauthorized | Bad auth credentials | Update datasource auth settings |
no data on rate()/increase() | Range smaller than scrape interval | Use [$__rate_interval] or a larger range |
empty result set | Time range outside data window | Widen the dashboard time range |
variable <name> resolved to empty | Broken template variable | Inspect the variable query |
panel plugin not found | Visualization plugin missing | Install plugin and restart Grafana |
Quick Diagnostic Checklist
When I am in a hurry, this is the order I check, top to bottom. Most “No Data” panels fail on the first three items.
- Datasource test passes?
- Time range covers actual data?
- Template variables resolve to non-empty values?
- PromQL is valid and uses a range larger than the scrape interval?
- Panel uses the correct datasource UID?
- Required plugin installed?
- Auto-refresh not faster than the slowest query?
- No mixed datasource issues (Grafana 11 regression)?
- Provisioned YAML/JSON valid?
- Panel JSON has at least one valid target?
Frequently Asked Questions
Why does my Grafana dashboard show ‘No Data’ when Prometheus queries work in Explore?
The most common causes are a mismatched time range, empty template variables, a scrape interval smaller than the rate() range, a wrong datasource UID on the panel, or a missing plugin. Start with the datasource test, then time range, then variables.
How do I connect Prometheus to Grafana?
Open Connections u0026gt; Data sources u0026gt; Add data source u0026gt; Prometheus. Set the URL to your Prometheus endpoint (for example http://prometheus.monitoring.svc.cluster.local:9090 in Kubernetes). Enable Basic auth if needed, click Save and test, and verify the green success banner.
Where is the Prometheus configuration file located?
On a typical install it is /etc/prometheus/prometheus.yml. In Kubernetes it is usually mounted from a ConfigMap into the Prometheus pod at the same path. Helm charts often expose it through values.yaml under prometheus.config.
How do I reload Prometheus without restarting it?
Send a SIGHUP to the Prometheus process. For systemd: systemctl reload prometheus. In Kubernetes, a rolling restart of the deployment also picks up changes if the config is mounted from a ConfigMap.
How do I change the Prometheus port?
Edit prometheus.yml and set u002du002dweb.listen-address=:9091 under command-line arguments, or change the port in your container spec. Then restart Prometheus and update the Grafana datasource URL to match.
What is the Prometheus dashboard URL?
The default URL is http://:9090. The Targets page is at /targets, configuration at /config, and the graph view at /graph. Use the same URL in your Grafana datasource settings.
How do I enable the Grafana Prometheus plugin?
The Prometheus data source is built into Grafana, so there is no plugin to enable. For community visualizations like pie charts, use grafana-cli plugins install .
What does ‘No Data as Zero’ mean in Grafana?
It is a panel setting under Standard options u0026gt; No value that maps missing data to a numeric zero. Enable it if you want gaps to display as 0 instead of blank panels. Disabling it keeps the panel truly empty when no data is returned.
Conclusion
A Grafana dashboard that shows “No Data” while Prometheus queries work is almost always a configuration gap inside Grafana, not a Prometheus outage. By following the diagnostic order in this guide, you will resolve most cases in under ten minutes.
Start by confirming Prometheus has the data. Then walk down the checklist: datasource connection, time range, template variables, scrape interval vs rate() range, mixed datasource, plugins, provisioned YAML, and finally panel JSON. For managed Grafana instances, double-check query timeout, network access, and organization permissions before you go deeper.
Once your dashboards are healthy again, I recommend saving the diagnostic checklist as a runbook in your monitoring wiki. The next time someone hits a “No Data” panel at 2 a.m., they will thank you.