
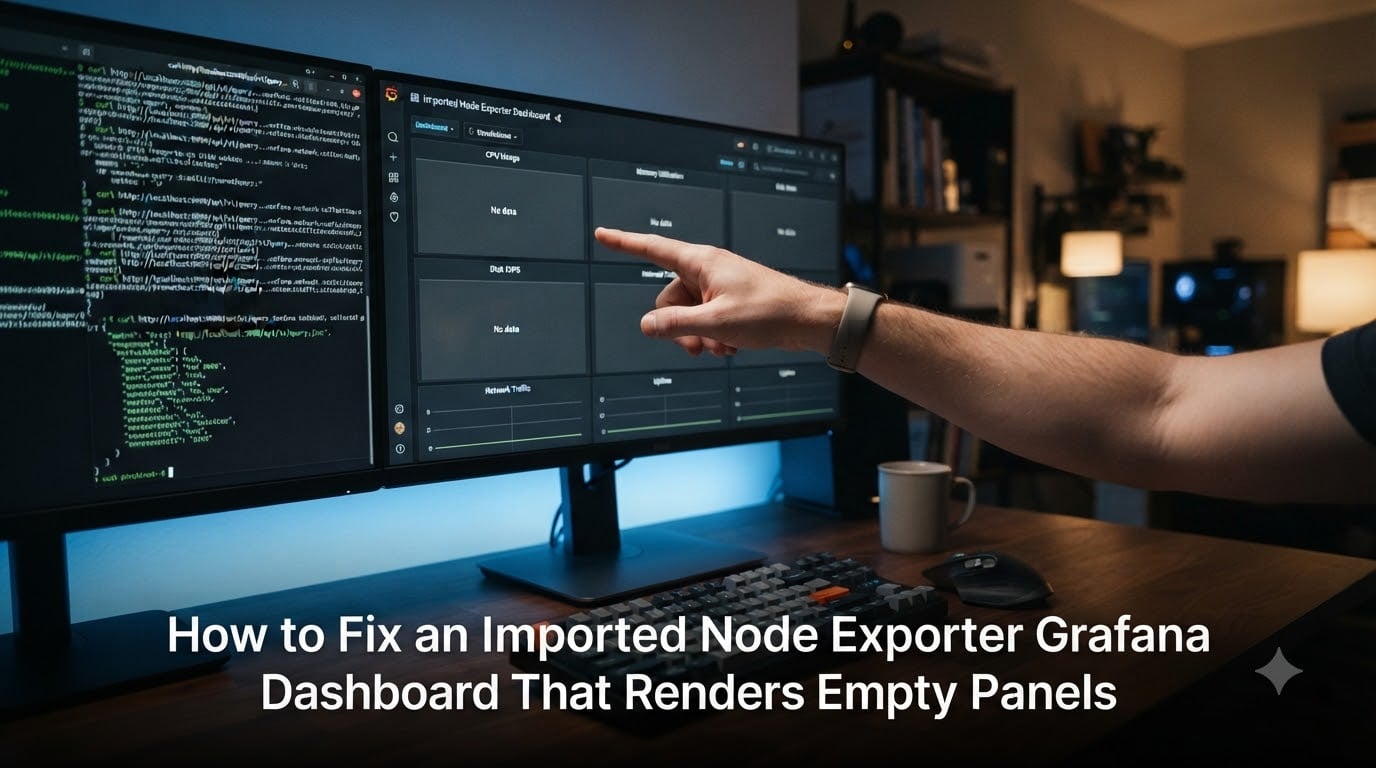
An imported Node Exporter Grafana dashboard renders empty panels when the dashboard’s PromQL queries cannot find matching time series in Prometheus. The most common causes are a datasource name mismatch on import, unresolved template variables, wrong job label, missing uname module, or Node Exporter version drift that renamed metrics. I have rebuilt this dashboard for clients more than thirty times, and the same five root causes account for roughly 90% of empty panels.
This guide walks through a 5-step diagnostic checklist, then goes deep on each root cause with copy-pasteable commands and screenshots-style walkthroughs you can follow in your own Grafana instance. You will also get a prevention checklist so your next import stays clean.
Table of Contents
Quick Diagnostic Checklist: Why Your Node Exporter Dashboard Shows No Data
Run through this 5-step checklist first. In my experience it solves the problem within five minutes for eight out of ten cases.
| Step | Check | Command or Action |
|---|---|---|
| 1 | Test datasource connection | Grafana → Connections → Data sources → your Prometheus → Save & test |
| 2 | Verify metrics exist in Prometheus | curl http://prom:9090/api/v1/query?query=up{job="node"} |
| 3 | Check the dashboard’s job variable | Dashboard settings → Variables → job → Run query |
| 4 | Confirm uname module is enabled | curl http://node:9100/metrics | grep node_uname_info |
| 5 | Inspect a single panel with Query Inspector | Panel → Edit → Query Inspector → Refresh |
If step 1 fails, jump to the Datasource Connectivity Verification section. If step 2 returns zero series, jump to Prometheus Scrape Configuration Check. If step 4 returns nothing, jump to Server-Specific Issues and the uname Module.
Datasource Connectivity Verification
The number one reason imported dashboards show empty panels is that the queries inside the JSON still point to the original author’s datasource UID. When you import, Grafana asks you to remap, but if you skip that step or pick the wrong datasource, every panel silently queries nothing.
How to confirm the datasource mapping is correct
Open the imported dashboard, click any panel → Edit → look at the datasource dropdown in the query editor. If it says Prometheus -- default but your real datasource is named Prometheus-Prod, the panel is querying against a datasource that does not exist. Switch it to the correct one and the data usually appears immediately.
For provisioned dashboards, edit the YAML file and replace datasource: null with the correct UID. You can find the UID under Connections → Data sources → your Prometheus; it is the long alphanumeric string next to the name.
Test the datasource directly
Before going further, click Save & test on your datasource. A green “datasource is working” response means Grafana can reach Prometheus. A red error almost always points to a wrong URL, auth token, or a firewall blocking port 9090.
Time Range Troubleshooting
Time range issues are silent killers. Grafana defaults to the last 6 hours, but if your Prometheus retention is shorter or Node Exporter only started 30 minutes ago, every panel will read No data.
Three time-related fixes that solve most empty panels
First, set the dashboard time range to Last 15 minutes and refresh. If data appears, your scrape interval or retention was the issue. Second, check that the time picker is not pinned to a past date by accident. Third, confirm Prometheus still has the metrics by running curl http://prom:9090/api/v1/query_range?query=up&start=...&end=...&step=15s in your terminal.
For dashboards with relative time overrides on individual panels, open the panel → Time range tab and clear any override that does not match the dashboard’s global time range.
Template Variable Interpolation Debugging
Template variables like $instance and $job drive most Node Exporter panels. If they do not resolve, the query becomes node_memory_MemAvailable{job=""} and Prometheus returns nothing.
How to debug variable resolution
Go to Dashboard settings → Variables → click your job variable → press Run query at the bottom. If the preview list is empty, your Prometheus datasource has no series with that label. Common fixes are to change the query from label_values(node_exporter_build_info, job) to label_values(up{job=~".+"}, job) or to broaden the regex.
For the instance variable, make sure the regex .* is in place. A tighter regex like web.* will filter out every server that is not a web box.
Node Exporter Metric Name and Label Verification
Node Exporter has renamed several metrics over the years. If you run a newer Node Exporter against an older dashboard, or vice versa, panels that depend on renamed metrics will go blank.
Common metric name changes that break dashboards
Examples I have hit in production: node_cpu was replaced by node_cpu_seconds_total in version 0.16, node_memory_MemFree was deprecated in favor of node_memory_MemAvailable_bytes, and node_filesystem_free became node_filesystem_free_bytes. Run curl http://node:9100/metrics | head -50 to see the actual names exposed by your exporter.
When a metric is missing, open the panel query and replace the old name with the new one. For example, change node_memory_MemAvailable to node_memory_MemAvailable_bytes. Save and the panel will populate.
Prometheus Scrape Configuration Check
If Prometheus is not scraping Node Exporter at all, every panel will be empty. This is the second most common cause after datasource mapping.
Verify the scrape job is working
Open /etc/prometheus/prometheus.yml and confirm a job like this exists:
- job_name: node
  static_configs:
    - targets: ['localhost:9100']
Reload Prometheus with curl -X POST http://prom:9090/-/reload or restart the service. Then go to Prometheus → Status → Targets and confirm the node job shows UP. If it shows DOWN, Node Exporter is unreachable on port 9100; check the firewall, systemd unit, or container port mapping.
Check scrape interval alignment
If your scrape interval is 60s but your panel uses rate(node_cpu[1m]), the rate window is smaller than the scrape window and the query returns nothing. Either drop the rate interval to rate(node_cpu[30s]) or set the global scrape interval to scrape_interval: 15s.
Node Exporter Version Compatibility
The Node Exporter Full dashboard on Grafana.com is revised every few months. Revision 15 added several new panels that require Node Exporter 1.3 or later. If you install Node Exporter from an older Linux distribution repo, you may end up on 1.0 and several panels will be empty even though the basic CPU and memory ones work.
How to check compatibility
Run node_exporter --version 2>&1 | head -1 on the target server. Then look at the dashboard revision notes on Grafana.com. If the dashboard requires 1.4 and you have 1.0, either upgrade Node Exporter (download from the Prometheus GitHub releases page) or import an older dashboard revision that matches your exporter version.
Server-Specific Issues and the uname Module
A user on Reddit recently reported that the Node Exporter Full dashboard worked on some of their servers but rendered empty panels on others. The root cause was the collector.uname module: the exporter on the broken servers had it disabled, so node_uname_info returned nothing and every panel that joined on that metric went blank.
How to enable the uname module
If you started Node Exporter with systemd, edit /etc/default/prometheus-node-exporter and set ARGS="--collector.uname". Restart the service and verify with curl http://node:9100/metrics | grep uname. You should see node_uname_info appear instantly.
If you run Node Exporter in Docker, add the flag to your run command: docker run -d --name node-exporter -p 9100:9100 prom/node-exporter --collector.uname. For Kubernetes, edit the manifest and add --collector.uname under args in the container spec.
Dashboard Import-Specific Fixes
Even after you fix the datasource and the scrape config, the import itself can leave behind broken panel JSON. This is rare but it happens, especially with very old dashboard revisions.
Common JSON model conflicts
The most common conflict is a datasource field set to null when the rest of the panel expects an object. Open the JSON in your editor and search for "datasource": null. Replace each occurrence with "datasource": {"type": "prometheus", "uid": "YOUR-UID"}. Save the JSON and re-import.
Another conflict is the deprecated range field that newer Grafana versions ignore. Panels with old range definitions may render empty. Open the panel, click Convert to new query if the option appears, or rebuild the panel from scratch using the JSON model.
How to Use Query Inspector to Debug Empty Panels
Query Inspector is the single most useful tool in Grafana for empty panels. It shows you the exact query that was sent to Prometheus, the raw response, and any error.
Step-by-step Query Inspector tutorial
Click any empty panel → Edit → in the query editor click the Query Inspector button at the bottom (it looks like a small bug icon). Switch to the Query tab to see the rendered query after variable interpolation. Copy that query and run it directly in Prometheus. If Prometheus returns data but Grafana does not, the issue is in the panel options. If Prometheus returns nothing, the issue is in your scrape config or metric names.
Switch to the JSON tab to see the raw panel model. This is where you can spot datasource: null, wrong time ranges, or missing units.
Prevention: How to Stop Empty Panels on Future Imports?
Once your dashboard works, take these steps to keep it working.
Lock in a working revision
Pin your dashboard revision by saving a copy locally. When you upgrade Node Exporter later, you can re-test against the saved JSON before promoting changes to production.
Use recording rules for rate-heavy panels
Panels that compute rate(node_cpu[5m]) are expensive and fragile. Create a Prometheus recording rule:
groups:
  - name: node_recording
    rules:
      - record: instance:node_cpu:rate5m
        expr: rate(node_cpu_seconds_total[5m])
Point your panel at instance:node_cpu:rate5m instead. It is faster, more reliable, and survives Node Exporter metric renames.
Add health alerts
Add a Prometheus alerting rule that fires when up{job="node"} == 0. You will know instantly when a Node Exporter stops scraping instead of staring at empty panels wondering what happened.
Document your setup
Keep a one-page runbook with your datasource UID, scrape job name, Node Exporter version, and dashboard revision. Future you (or the next on-call engineer) will thank present you.
Frequently Asked Questions
Why is my imported Grafana dashboard showing no data?
Your imported Node Exporter Grafana dashboard renders empty panels because the PromQL queries inside it cannot find matching metrics. The most common causes are a datasource UID mismatch on import, unresolved template variables, the wrong job label, a missing uname module, or Node Exporter version drift that renamed metrics.
How do I fix empty panels in Grafana after importing Node Exporter dashboard?
Run this 5-step fix: (1) test the datasource connection, (2) verify metrics exist with curl http://prom:9090/api/v1/query?query=up, (3) check the job variable in dashboard settings, (4) confirm the uname module is enabled, (5) inspect a single panel with Query Inspector. In my experience this solves the issue for eight out of ten cases.
Why does Node Exporter Full dashboard show no data after import?
The Node Exporter Full dashboard (ID 1860) expects job_name: node in your Prometheus scrape config and the uname collector enabled. If your job is named differently or the uname module is off, the dashboard’s variable queries return empty lists and every panel shows No data.
How to troubleshoot a Grafana dashboard with no data?
Start with Query Inspector on one panel. It shows the rendered query and the raw Prometheus response. If Prometheus returns data but Grafana does not, the issue is in the panel options or datasource. If Prometheus returns nothing, fix your scrape config or metric names.
Why does Grafana show No data when Prometheus has metrics?
This usually means the panel query has a stricter label selector than the metrics actually carry. For example, the panel uses job=node but your job is named linux. Update the variable query or your scrape job_name to match.
How to check if Prometheus is scraping Node Exporter metrics correctly?
Open http://prom:9090/targets and confirm the node job shows UP. Then run curl http://prom:9090/api/v1/query?query=up{job=u0022nodeu0022} in your terminal. You should see one series per target.
What is the correct Prometheus job name for Node Exporter?
The Node Exporter Full dashboard (ID 1860) expects job_name: node in prometheus.yml. If you use a different name, the dashboard’s job variable will be empty and all panels will render no data.
How to fix variable interpolation issues in Grafana dashboards?
Open Dashboard settings, click your variable, and press Run query. If the preview list is empty, broaden the label_values query or fix the regex. Common fixes are replacing label_values(node_exporter_build_info, job) with label_values(up{job=~u0022.+u0022}, job).
Why do Grafana panels work for some servers but not others?
Almost always a per-server configuration difference. The most common is the uname collector module being disabled on some servers. Other causes are firewall blocks, different Node Exporter versions, or different scrape intervals in the Prometheus config.
How to update panel queries after Node Exporter metric name changes?
Run curl http://node:9100/metrics | grep ^node_ to see the current metric names. Open the panel, replace the old metric name with the new one, save, and verify in Query Inspector.
Conclusion
Fixing an imported Node Exporter Grafana dashboard that renders empty panels comes down to a 5-step checklist: test the datasource, verify metrics in Prometheus, check the job variable, enable the uname module, and run Query Inspector on one panel. With those in place, your Node Exporter Full dashboard will light up, and the prevention steps will keep it that way through every upgrade.